The dog days of summer have descended on capital markets in recent weeks. Following a blistering rally that began with the government resolution to the banking crises in March and accelerated as we moved into the summer months, U.S. stocks have been fading to the downside since the start of August. What can we take away from this recent pullback and how much further can we reasonably expect stocks to fall from here before finding a bottom?
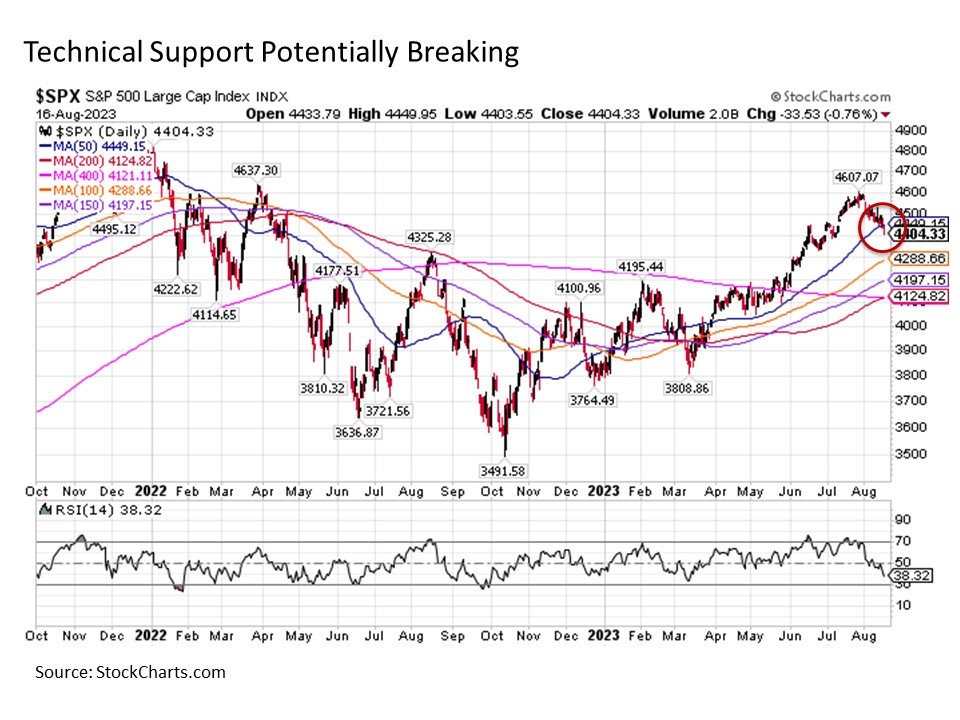
Summer swelter. The last few weeks have been wilting for U.S. stocks. After peaking at a 2023 high of 4607 back on July 27, the S&P 500 has dropped more than -4% since toward the 4400 level. While the descent has been gradual, it has also been a consistent grind to the downside. For example, the large cap S&P 500 has fallen in nine out the last twelve trading days and the small cap S&P 600 has been lower in all but one trading day over the same time period.
It should be noted before going any further that this recent retreat in stocks thus far in August was long overdue. In the preceding months of June and July, the S&P 500 had soared by more than +12%. In the process, the headline benchmark index was running well ahead of trend and had become meaningfully overbought. As a result, it could be argued that the relatively modest decline following such a sharp rally is a healthy consolidation of recent gains. If anything, clearing some of the froth from the recent market rally should help set the market up for the next sustained move to the upside. Nonetheless, we are seeing some potentially troubling cracks that warrant closer investigation and may be signaling that we could see further downside in the weeks ahead before the current pullback has fully run its course.

Losing support. One problematic development has been the potential break of key technical support. The S&P 500 had been trading above its medium-term 50-day moving average since the end of March. And even though it had been trading more than +7% above this key support level as recently as a few weeks ago in late July, the S&P 500 broke below its 50-day M.A. on Tuesday and failed in its first attempt to reclaim this support level on Wednesday. While it is too early to declare the 50-day moving average support officially breached, some related indicators suggest that this technical break on the benchmark index will eventually be confirmed.
One key signal is the recent trend in information technology stocks. Over the last several years, leading tech stocks like Apple, Microsoft, and NVIDIA along with a few tech adjacent names found in other sectors like Amazon and Tesla in consumer discretionary, Alphabet and Meta in communications services (the so called Magnificent Seven) have grown so far ahead of the market that they now make up nearly 30% of the weighting of the S&P 500. This is historically an extraordinary degree of market concentration in so few names. Why does this matter? Because if these stocks falter, they will likely bring the entire S&P 500 lower with them.
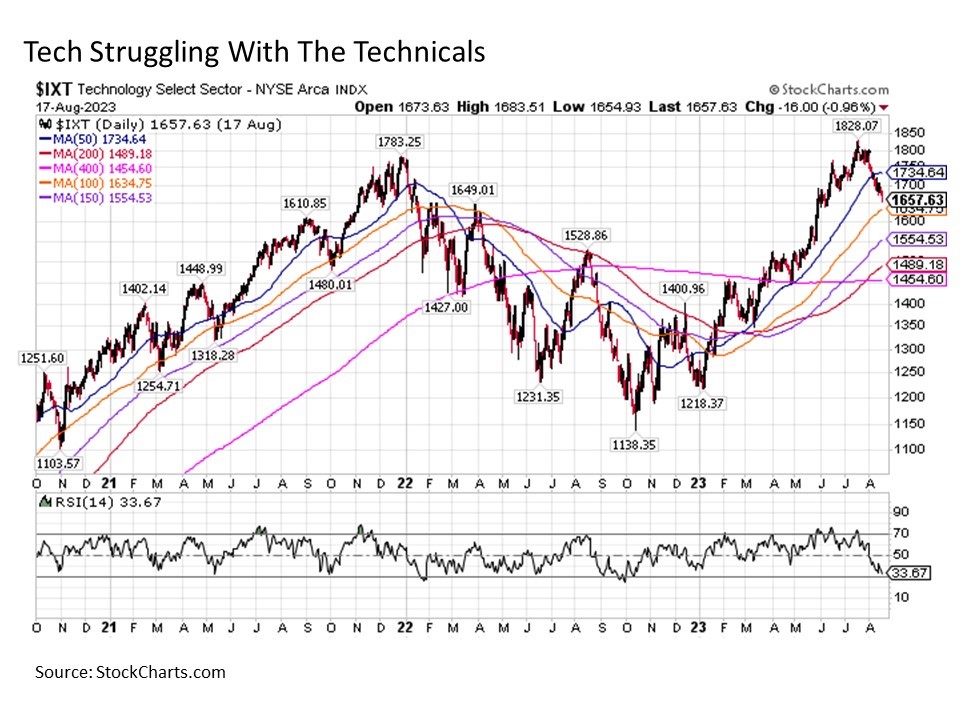
Over the past month, a number of these Magnificent Seven names were foreshadowing the broader market move to the downside. For while the S&P 500 peaked on July 27, names like NVIDIA, Tesla, and Microsoft had topped more than week earlier in mid-July and have dropped between by -13% and -25% in the month since. Other names like Apple and Meta have also fallen by double-digits in recent weeks as well. As a result, all have sliced through their respective 50-day moving averages to varying degrees and most are still trending decisively to the downside.

Thus, we see the technology sector as a whole having already left 50-day moving average support behind weeks ago and now searching for its next support level to find its footing. Having already declined by -9% since its mid-July peak, the next likely landing spots including the 100-day, 150-day, and 200-day moving averages at -2%, -7%, and -11% below current levels. And if big tech and friends still have room to the downside in the near-term, anticipate that it will drag the broader market S&P 500 lower with it.
Putting this all together, we should not be surprised to see the S&P 500 falling further toward 4300 and its own 100-day moving average in the coming weeks.
Liquidity thirst. While tech may be the main culprit dragging the market lower right now, it should be noted that it is not the only sector moving to the downside in recent weeks. For while energy, health care, and communications services continue to hold up well, materials, industrials, consumer discretionary and staples, financials, real estate, and utilities have also recently taken sharp cuts to the downside to varying degrees. This broader based decline suggests that liquidity forces may also be at work in dragging the market lower at a time of the year in August where trading volumes are already notoriously light (i.e. if you’re lounging on the beach in the Hamptons, you’re probably executing fewer trades than normal).

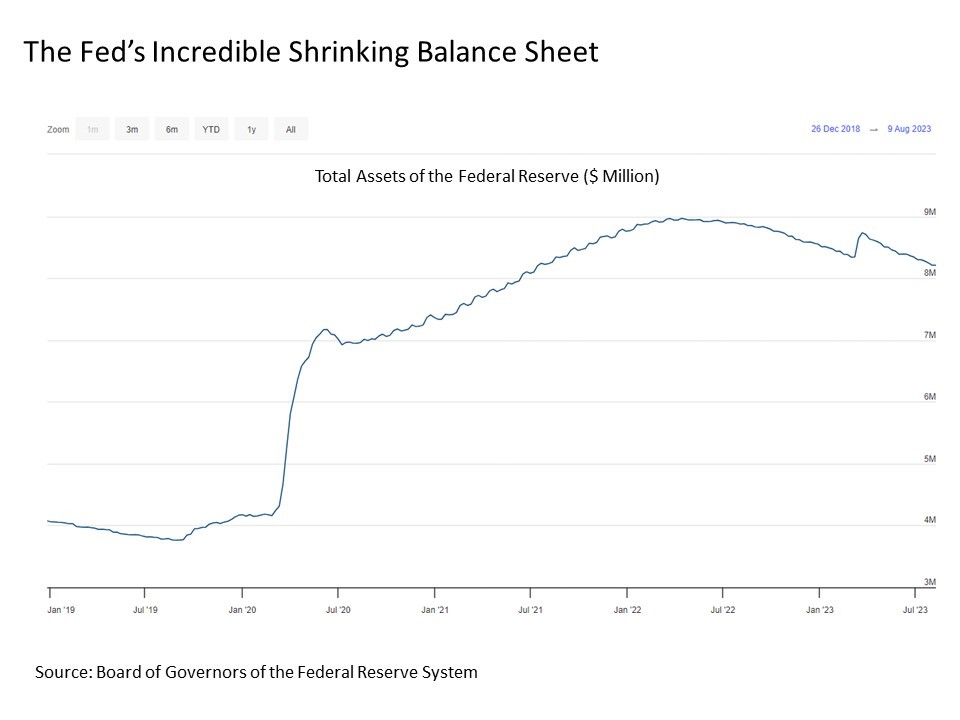
One key liquidity reading for financial markets is the Fed’s balance sheet, which is shown in the chart above. Now, we’ve all come to understand that the best way to propel the U.S. stock market to a new high +40% above the previous peak during a global pandemic is to inject trillions of dollars of monetary policy rocket fuel from the U.S. Federal Reserve. The only problem is that you can leave the global economy with a scorching case of inflation in the process, which is the battle that we’re still fighting for more than 18 months and counting to date. The same can happen when you drop $400 billion in a month like March in response to banking crises, which may help to explain why the stock market did so well through the spring and into the summer.
On the flip side, if the Fed is draining liquidity from the financial system through shrinking its balance sheet, this can serve as a drag on stock performance. The Fed finished mopping up its spring liquidity injection by the end of June, and continues to steadily reduce its balance sheet by $100 billion per month on average. As long as the Fed continues to reduce the assets on its balance sheet, it will likely serve as a financial market drag on the margins.

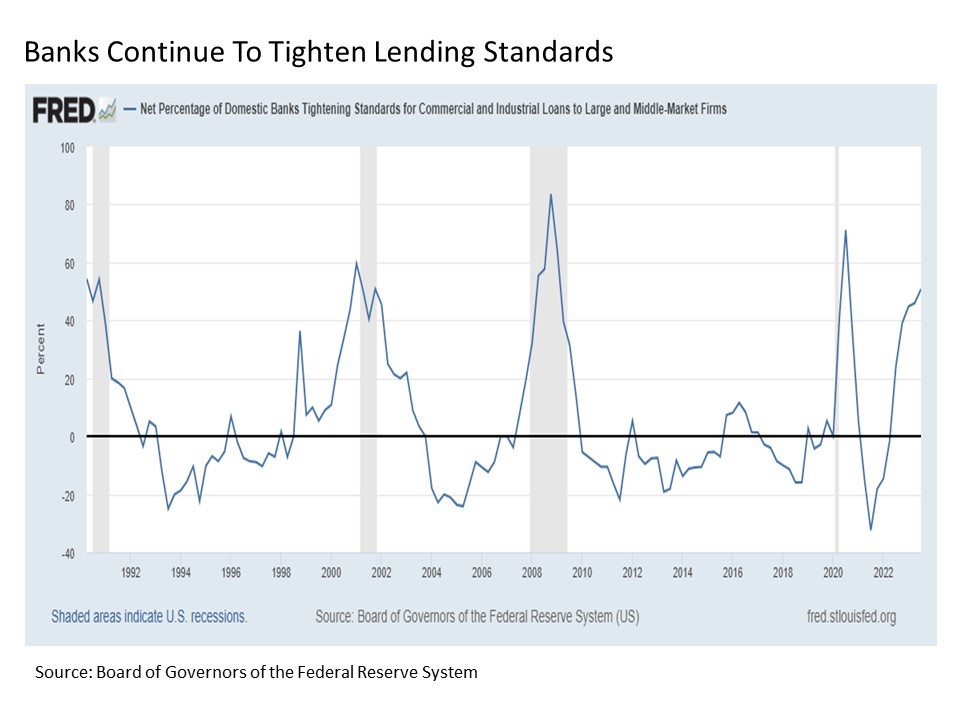
Another potential drag for stock prices and the broader economy in the months ahead, particularly if broader liquidity conditions continue to tighten going forward, is a further reduction in available credit from the banks. According to the Fed’s latest Senior Loan Officer Opinion Survey on Bank Lending Practices, the net percentage of U.S. banks tightening lending standards jumped to just over 50%. Put simply, more than half of all banks in the U.S. are planning on being more restrictive on who they lend money to and how they lend it out this quarter. And less availability of bank credit means less available liquidity in the economy and financial markets all else equal, which can serve as an additional drag on asset prices.
These are just two of the various liquidity signals worth watching in relation to stock prices as we continue through the remainder of the year that have the potential to drag down stock prices further than we might expect at any given point in time.
Disclosure: I/we have no stock, option or similar derivative position in any of the companies mentioned, and no plans to initiate any such positions within the next 72 hours. I wrote this article myself, and it expresses my own opinions. I am not receiving compensation for it. I have no business relationship with any company whose stock is mentioned in this article. Investment advice offered through Great Valley Advisor Group (GVA), a Registered Investment Advisor. I am solely an investment advisor representative of Great Valley Advisor Group, and not affiliated with LPL Financial. Any opinions or views expressed by me are not those of LPL Financial. This is not intended to be used as tax or legal advice. All performance referenced is historical and is no guarantee of future results. All indices are unmanaged and may not be invested into directly. Please consult a tax or legal professional for specific information and advice.
Tracking #469055-2
